Medical Imaging PACS & VNA Market Research Report –Segmentation by Component (Software, Services, Others); by Deployment Mode (On-Premises, Cloud-Based, Hybrid, Others; by Imaging Modality (Radiology, Cardiology, Oncology, Orthopedics, Mammography, Others); by End User (Hospitals, Diagnostic Imaging Centers, Specialty Clinics, Academic & Research Institutes, Others) ; and Region - Size, Share, Growth Analysis | Forecast (2026– 2030)
Global Medical Imaging PACS & VNA Market Size (2026-2030)
In 2025, the Medical Imaging PACS & VNA Market was valued at approximately USD 4.85 Billion. It is projected to grow at a CAGR of around 11.9% during the forecast period of 2026–2030, reaching an estimated USD 8.51 Billion by 2030.
The Global Medical Imaging PACS & VNA Market includes technologies and solutions to store, manage, retrieve, distribute, and archive medical images in healthcare settings. Picture Archiving and Communication Systems are used to support clinical imaging workflows, and Vendor Neutral Archives are used to store and share images for the long term across multiple systems. It includes the platforms, supporting infrastructure, implementation and migration, maintenance, and workflow management. It does not include imaging equipment (MRI, CT), other hospital information management systems, and non-clinical data storage systems used for non-imaging purposes.
The market has evolved from departmental-based image storage to enterprise imaging approaches. Patients, clinicians, and administrators now seek easy access to images across radiology, cardiology, oncology, orthopedics, and other specialties across multiple sites. The move to the cloud has gathered pace as companies look for flexibility, enhanced disaster recovery, and lower costs with improved predictability, though hybrid deployments are still common when latency issues, regulatory considerations, or legacy systems are involved. Meanwhile, security, governance, and vendor lock-in risks have climbed the corporate ladder, from IT to the boardroom, as concerns over cybersecurity, data sovereignty, and the complexities of multi-vendor integration increase.
This market has evolved for decision-makers from IT products to strategic infrastructure. Customers are considering migration and interoperability needs, availability, and future archive control in the context of purchase price. Health care providers are seeking solutions that can consolidate multiple image archives and accommodate growth. Imaging vendors offering flexible deployment options, deep integration, and workflow improvements are best positioned to meet demand as healthcare systems upgrade their imaging infrastructure.
Key Market Insights
AI spending in healthcare grew 67%, driving growth in imaging workflow automation.
20% lower cloud infrastructure costs made PACS upgrades more attractive.
Generative AI trials at 70% providers support imaging productivity strategies.
Data interoperability needs grew 52%, boosting VNA replacement interest worldwide.
Cybersecurity costs 1.9x more to healthcare firms.
A 16% growth in Asia Pacific's digital health investments boosted imaging.
Cloud-first approaches to core systems are favored by 75% of executives.
Workflow automation reduced administrative costs by 30%, helping radiology.
Hybrid cloud usage was over 60%, aiding archive migration.
AI-based diagnosis boosted productivity 25% in trials.
Asia has higher growth than the North American market.
Data will be modernized in two years, 80% of leaders say.
Research Methodology
Scope & definitions
Covers operating revenue from medical imaging PACS and vendor neutral archive (VNA) software, hardware, and related implementation/support tied to image management workflows.
Excludes unrelated EHR modules, standalone imaging devices, and non-clinical IT spend.
Geography: North America, Europe, Asia-Pacific, Latin America, Middle East & Africa; historical base, current year estimate, and forecast period defined in-report.
Segmentation follows component, deployment mode, imaging modality, end user, and region.
Standardized data dictionary, currency normalization, and supplier mapping prevent overlap/double counting.
Evidence collection (primary + secondary)
Primary research across OEMs, PACS/VNA vendors, cloud providers, distributors, hospital IT leaders, radiology administrators, imaging centers, and channel partners.
Secondary sources include audited filings, investor presentations, company websites, procurement databases, peer-reviewed journals, OECD, WHO, FDA, European Commission, HIMSS, RSNA, and relevant regulators/standards bodies/industry associations specific to Global Medical Imaging PACS & VNA Market (named in-report).
Key claims are supported with verifiable, source-linked evidence in-report.
Triangulation & validation
Bottom-up sizing from vendor revenues, installed base, contracts, and ASPs.
Top-down sizing from healthcare IT, imaging informatics, and regional spend benchmarks.
Results reconciled to financial disclosures where applicable.
Conflicting sources resolved through recency, methodology quality, and multi-source consensus controls.
Presentation & auditability
All assumptions, formulas, sources, and revisions logged.
Segment totals reconcile to 100%; CAGR and forecast models are traceable and review-ready.
Global Medical Imaging PACS & VNA Market Drivers
Increasing need for interoperable enterprise imaging environments across systems
Interoperable imaging ecosystems that link radiology, cardiology, oncology, and other imaging modalities into a common data model are a growing priority for healthcare providers. This is in response to the need to streamline disjointed systems of storage and access to diagnostic images. Picture archiving and communication systems (PACS) and vendor-neutral archives (VNA) are increasingly vital components of enterprise imaging strategies, facilitating the sharing of data between hospitals, diagnostic imaging facilities, and specialty clinics.
Speedy move to cloud and hybrid imaging infrastructure
Healthcare providers are increasingly shifting from on-premises to cloud-based and hybrid imaging infrastructure models for scalability, flexibility, and accessibility. The shift is being driven by the growth in imaging data, growing storage needs, and requirements for clinical disaster preparedness. PACS and VNA systems hosted on the cloud facilitate rapid access to images, image management, and fewer infrastructure demands on hospitals.
Increasing demands for cost efficiency and system upgrades
Hospitals are constantly challenged to replace legacy imaging systems while keeping costs under control and avoiding vendor lock-in. Inefficiencies in managing data migration, integration, and scalability of storage in legacy PACS systems drive the need for integrated PACS and VNA systems. This eliminates data duplication, simplifies management, and enhances data lifecycle management.
Global Medical Imaging PACS & VNA Market Restraints
Constraints and challenges in the global medical imaging PACS & VNA market include increasing integration complexities, legacy system lock-ins, and the increasing cost of data migration in multi-site imaging environments. Healthcare providers face challenges integrating legacy and new systems, which delay transition to integrated imaging systems. Growing cloud-based deployments create cybersecurity threats, requiring more security controls.
Global Medical Imaging PACS & VNA Market Opportunities
Market opportunities in the global medical imaging PACS & VNA market are growing as providers ramp up their cloud adoption, imaging platform consolidation, and integration upgrades in multi-site environments. Suppliers can leverage the burgeoning need for AI-powered imaging operations, particularly in radiology and oncology, with increasing diagnostic loads.
How this market works end-to-end
Image is created
Modalities such as radiology, cardiology, oncology, orthopedics, and mammography generate studies that need routing and storage.
Data is ingested
PACS captures the study, applies workflow rules, and makes the image immediately available to clinicians.
Access is coordinated
Authorized users view, compare, and report on images across departments, sites, and sometimes external referral networks.
Archive is governed
VNA provides long-term, vendor-neutral retention so records can be preserved across system changes and migrations.
Systems are integrated
PACS and VNA connect with RIS, EMR, identity systems, cybersecurity tools, and analytics layers.
Deployment is chosen
Buyers decide between on-premise, cloud-based, or hybrid models based on control, latency, compliance, and cost.
Ownership is scaled
Hospitals, diagnostic imaging centers, specialty clinics, and academic users prioritize different uptime, storage, and governance needs.
Region shapes design
North America, Europe, Asia-Pacific, Latin America, and Middle East & Africa differ on regulation, cloud readiness, and procurement pace.
Why this market matters now
The market is being shaped by a simple tension: clinical teams need faster access to images, while IT teams need tighter control over cost, security, and data portability. That tension makes PACS and VNA decisions more strategic than routine software buys.
A weak architecture can lock a buyer into a slow migration path, limit interoperability, and create hidden retention costs. A strong one can reduce switching risk, support multi-site expansion, and make future cloud adoption less disruptive. The real issue is not whether imaging systems exist today. It is whether they can still work cleanly when volume rises, cyber rules tighten, or a vendor strategy changes.
What matters most when evaluating claims in this market
Claim type
What good proof looks like
What often goes wrong
Market size
Clear boundary, defined revenue pool, consistent segment logic
Mixing software, hardware, and unrelated IT spend
Cloud adoption
Named deployment scope and buyer use case
Treating pilot interest as full-scale conversion
Interoperability
Documented integrations and workflow evidence
Counting compatibility claims as live deployments
Vendor leadership
Comparable revenue basis and region coverage
Using brand visibility instead of measurable share
Migration success
Verified installs, go-live evidence, and retention outcomes
Confusing announced deals with operating revenue
The decision lens
Set the boundary
Confirm whether the need is PACS, VNA, or both, and whether the buying unit is software-only or bundled infrastructure.
Map the workflow
Trace how images move from modality to archive to viewer, then identify where delays, duplications, or manual work appear.
Test deployment fit
Compare on-premise, cloud, and hybrid options against latency, control, compliance, and internal IT capacity.
Check integration depth
Verify links to EMR, RIS, identity, security, and reporting tools, not just marketing claims.
Stress migration risk
Ask how data will move, who owns the archive, what downtime is acceptable, and how rollback is handled.
Price the full path
Compare license, implementation, maintenance, storage, training, support, and exit costs, not just entry pricing.
The contrarian view
The biggest mistake is treating PACS and VNA as a single uniform market. They solve different problems, and buyers often need both for different reasons. Another common error is using deployment labels as a proxy for readiness. A cloud logo does not prove operational fit, and an on-premise system does not prove resilience. The third mistake is hidden double counting, especially when vendors package storage, services, and software together. Good analysis must separate operating revenue from implementation noise and avoid counting the same workflow twice across modalities or end users.
Practical implications by stakeholder
Hospital CIO and IT leader
Needs architecture that reduces lock-in without creating new migration risk.
Must weigh uptime, security, and integration cost together.
Should challenge any claim that ignores exit planning.
Radiology leadership
Needs fast image access, stable reporting, and minimal workflow friction.
Should compare modality-specific fit, not just enterprise branding.
Must assess whether the vendor supports multi-site consistency.
Imaging center operator
Needs predictable costs, quick deployment, and reliable sharing with referrers.
Should favor simple workflows over complex feature bundles.
Must test whether support is strong enough for lean IT teams.
Cybersecurity and compliance teams
Needs proof of access control, auditability, backup, and retention governance.
Should examine data movement, user authentication, and incident response.
Must verify how regional rules affect hosting and archiving.
Vendors and partners
Must prove interoperability, not just feature depth.
Need clear segmentation by component, deployment, modality, end user, and geography.
Should address migration economics and data ownership early.
ROBOTICS MARKET REPORT COVERAGE:
REPORT METRIC
DETAILS
Market Size Available
2025 - 2030
Base Year
2025
Forecast Period
2026 - 2030
CAGR
11.9%
Segments Covered
By component, Deployment Mode , Imaging Modality , End User , and Region
Various Analyses Covered
Global, Regional & Country Level Analysis, Segment-Level Analysis, DROC, PESTLE Analysis, Porter’s Five Forces Analysis, Competitive Landscape, Analyst Overview on Investment Opportunities
Regional Scope
North America, Europe, APAC, Latin America, Middle East & Africa
Key Companies Profiled
GE HealthCare, Philips Healthcare, Siemens Healthineers, Fujifilm Holdings Corporation, Agfa-Gevaert Group, Sectra AB, Merge Healthcare, Intelerad Medical Systems, Carestream Health, Konica Minolta, Inc., Canon Medical Systems Corporation, Dedalus Group, Hyland Software, Inc., INFINITT Healthcare Co., Ltd., and Novarad Corporation
Global Medical Imaging PACS & VNA Market Segmentation
Global Medical Imaging PACS & VNA Market – By Component
Software is the leading component segment by share at 68.4% in 2026, with enterprise PACS, VNA archives, and sophisticated image viewing software. Suppliers preferred flexible licenses and subscriptions to enhance workflow efficiency, interoperability, and access to images over networks around the world.
Services are the fastest-growing component, growing at an 11.9% CAGR to 2030, driven by increased migration, security, integration, and managed services. Use of outsourced upgrades and archive migrations grows to limit disruption, risk, and staffing demands on the health system.
Global Medical Imaging PACS & VNA Market – By Deployment Mode
On-Premises was the largest deployment mode segment, with a 46.8% share in 2026, as hospitals maintain control and low-latency access to infrastructure while ensuring data integrity. Existing installed bases and integration needs sustained replacement and upgrades globally.
Cloud-based is the highest-growing deployment mode with a CAGR of 14.6% by 2030. Customers prefer scalability, reduced capital expenditures, remote access, and superior disaster recovery to upgrade enterprise imaging environments cost-effectively globally.
Global Medical Imaging PACS & VNA Market – By Imaging Modality
Global Medical Imaging PACS & VNA Market– Regional Analysis
North America
Europe
Asia-Pacific
Latin America
Middle East and Africa
North America remained the largest region with 39.0% share in 2026 due to established imaging networks, healthy healthcare IT spending, and replacement cycles. Cybersecurity, interoperability, and enterprise archive modernization were preferred by large hospitals for integrated care systems.
The Asia-Pacific region is the fastest-growing, with a 13.7% CAGR to 2030. Increasing diagnostic procedures, hospital construction, and fast-growing cloud computing in China, India, Japan, and Southeast Asia are fueling growth in imaging systems.
Latest Market News
Mar 18, 2026: GE HealthCare said it has closed the Intelerad deal, paying a base price of $2.3 billion to acquire a company that will add some $270 million in first full-year revenue. Further, it said 90% of Intelerad revenue is recurring, reflecting the trend to cloud-based imaging software.
Feb 21, 2026: News on PACS software showed that a CT study may consist of over 1,000 images, and busy radiology clinics may handle hundreds of studies per day. The take-home message was that scalability and speed of archives and workflows are IT priorities for boards.
On Nov 20, 2025, GE HealthCare said it would pay $2.3 billion in cash for Intelerad with the plan to close in the first half of 2026, subject to approvals. The company stated that the acquisition helps it to triple cloud offerings by 2028.
On Nov 20, 2025, GE HealthCare released that Intelerad should bring in about $270 million in revenue in the first 12 months post-closing with EBITDA margins exceeding 30%. For PACS and VNA customers, this is a sign of increased strategic importance of recurring SaaS imaging.
May 15, 2025: Revised forecasts for the industry noted the market's 2024 installed revenue base of around $4.62 billion and 2025 forecast of $5.10 billion, due to continued replacement and migration to the cloud. Buyer commentary focused on interoperability, analytics, and modernizing archives.
Jun 11, 2024 New market analysis noted multiple-site VNA deployments were expected to be the fastest-growing architecture through 2029, with on-premises deployments remaining the leading architecture in 2023. The study mapped over 400 pages of vendor and geographic intelligence, shining a spotlight on the buyer interest in enterprise imaging strategy.
May 30, 2024 A competitive review tracked procurement of enterprise PACS and VNA and deployments, including on-premise, cloud, and hybrid, to 2031. The research focused on modality needs (CT, MRI, ultrasound) for 3+ imaging segments.
Key Players
GE HealthCare
Philips Healthcare
Siemens Healthineers
Fujifilm Holdings Corporation
Agfa-Gevaert Group
Sectra AB
Merge Healthcare
Intelerad Medical Systems
Carestream Health
Konica Minolta, Inc.
Questions buyers ask before purchasing this report
What is the real scope of the Global Medical Imaging PACS & VNA Market?
This report focuses on the revenue pool tied to PACS and VNA use in imaging workflows. It separates core software and related infrastructure from broader hospital IT, imaging devices, and unrelated clinical software. That matters because buyers often compare reports that use different boundary rules. A clean scope lets decision-makers see what is really driving spend, what is bundled, and where double counting can distort the size of the market.
Does the report cover both PACS and VNA in a usable way?
Yes, and that distinction is critical. PACS is about daily image access and clinical workflow, while VNA is about long-term, vendor-neutral retention and portability. Many buyers need both, but not for the same reason. A strong report should show how these systems interact, where they overlap, and where the economics differ. That is what helps teams decide whether they need refresh, replacement, expansion, or a hybrid transition.
How does the report help with cloud versus on-premise decisions?
It should help buyers compare deployment models against real operating constraints. Cloud may improve flexibility, but it also changes control, cost structure, integration design, and migration risk. On-premise can preserve direct control, but it may increase maintenance burden. Hybrid is often the practical middle path. A useful report should show which deployment choices fit which buyer type, rather than treating cloud adoption as a universal endpoint.
Why is segmentation important in this market?
Segmentation changes the answer. A hospital group, imaging center, and specialty clinic do not buy PACS and VNA the same way. Neither do radiology and cardiology workflows. Geography also matters because procurement pace, cloud acceptance, and compliance pressure vary by region. A report that segments by component, deployment mode, imaging modality, end user, and geography helps buyers compare like with like and avoid broad averages that hide real differences.
What kinds of risks should a buyer expect this report to clarify?
The most important risks are vendor lock-in, migration disruption, cyber exposure, hidden integration cost, and underestimated storage or retention obligations. Buyers also need to see where growth assumptions may be overstated by bundled offerings or loose market definitions. A good report should help teams stress-test timing, compare suppliers, and understand whether a purchase is solving a real operational problem or simply delaying a larger one.
How does this report support a purchase decision under budget pressure?
It should show where spend creates operational value and where it does not. That means separating must-have workflow stability from optional features, comparing deployment paths, and identifying which segment is truly under pressure to replace legacy systems. In a budget-constrained environment, the right question is not just what the market is worth. It is which buying choice reduces risk, protects continuity, and improves image access without adding hidden future cost.
To Learn more about this report,
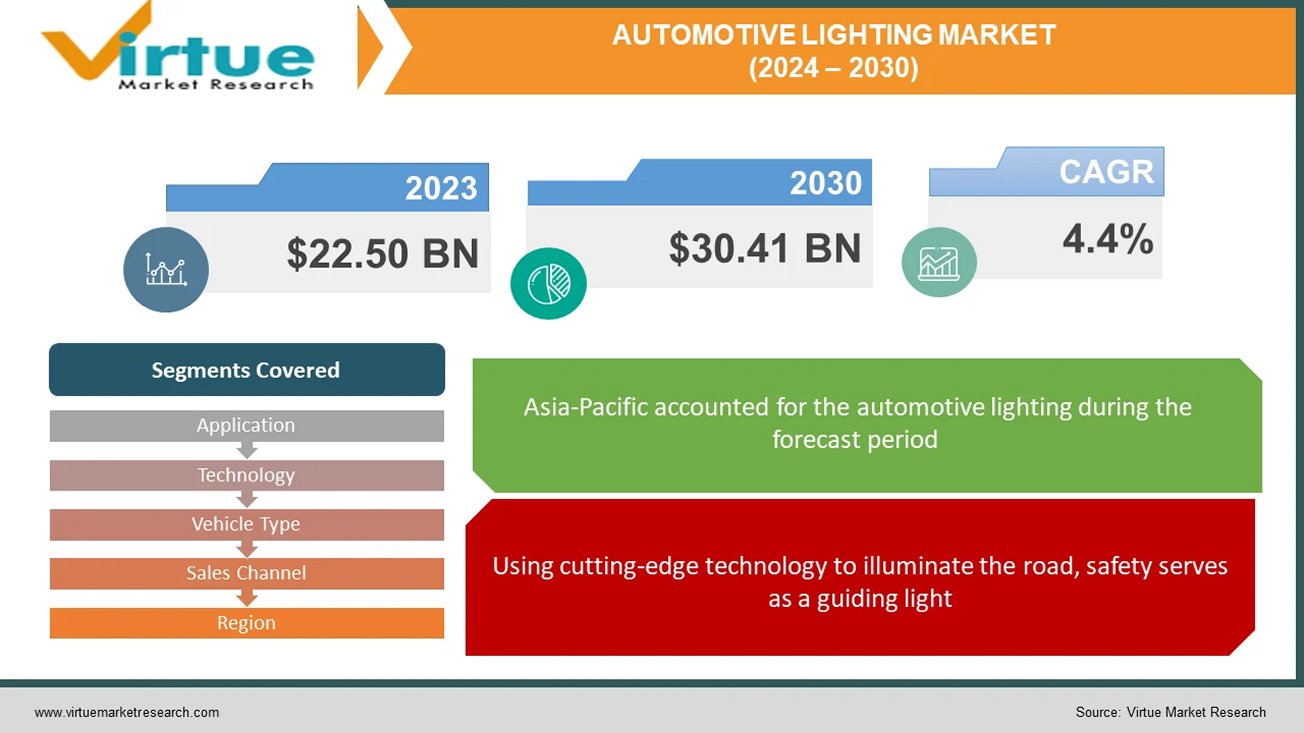
Global automotive lighting refers to all vehicle lighting systems, from headlamps that illuminate the road to taillights that communicate movements. They guarantee motorists and other road users alike safety, visibility, and style. While taillights frequently use LEDs for improved visibility, headlights are available in a variety of technologies, including LED and laser. Interior illumination, DRLs, and signal lights all have a role to play. This market, which was estimated to be worth $33.64 billion in 2022, is anticipated to rise to $67.39 billion by 2030 because of laws, luxury tastes, safety concerns, and technological developments like OLED taillights and adaptive headlights. Anticipate a future dominated by intelligent, connected, personalized, and sustainable lighting systems that enhance the safety, efficiency, and aesthetic appeal of automobiles.
Key Market Insights:
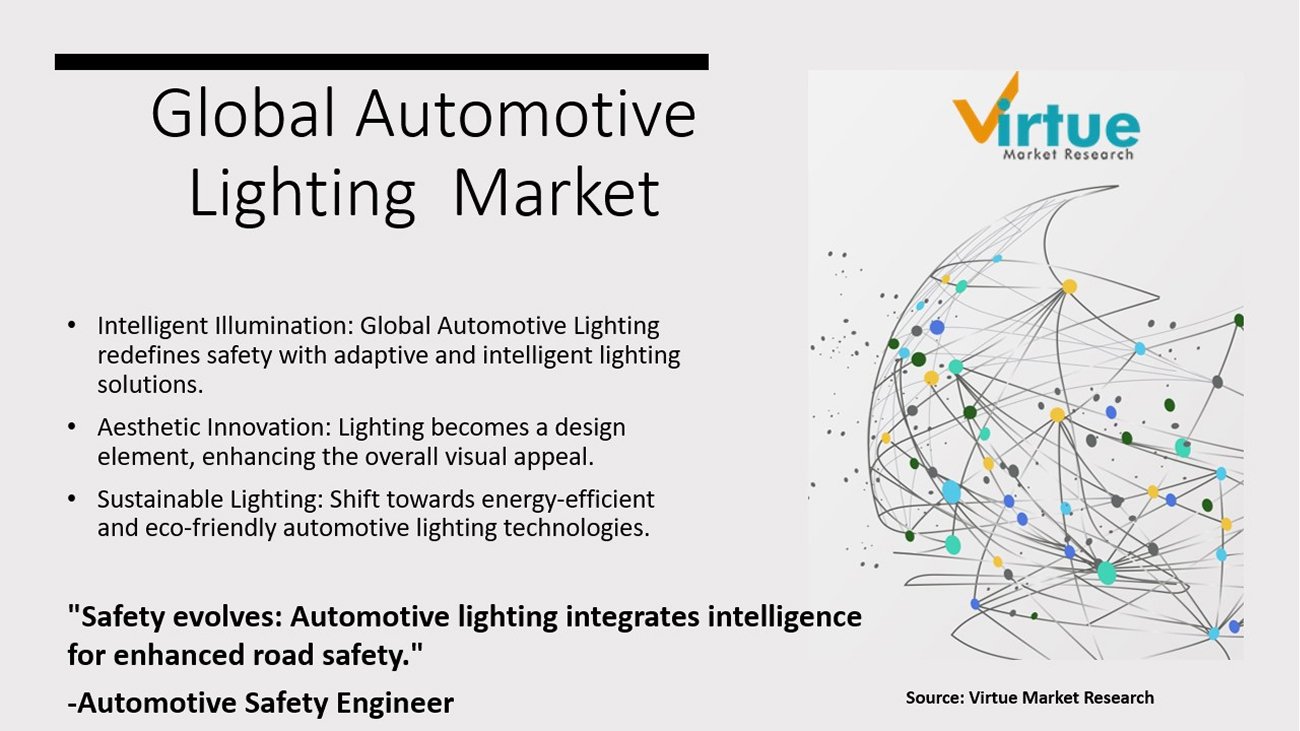
Car lighting works its magic to provide safety, visibility, and style. Headlights cut through the night, taillights express intent, and interiors shine with comfort. The billion-dollar global business is expected to rise due to consumer demand for high-end experiences, safer roads, and cutting-edge technology. Imagine dynamic messages being painted by taillights, headlights that adjust to the road, and interiors that customize their atmosphere. Driven by technological advancements like linked systems and laser beams, this future is calling. Anticipate even more visually attractive, environmentally friendly, and intelligent lighting to illuminate the way ahead, making cars safer, more efficient, and unquestionably cooler.
Global Automotive Lighting Market Drivers:
Using cutting-edge technology to illuminate the road, safety serves as a guiding light.
In the market for automobile lighting, safety is the driving force behind demand from the public and laws. While automated high beams smoothly react to traffic, adaptive headlights modify their beams so as not to blind other people. With visually striking displays, dynamic taillights convey intentions for braking and turning. Beyond these developments, integrated pedestrian identification and lane departure alerts will soon make roads safer and brighter for everyone.
Beyond Performance-Based Luxuries Redefined by Light.
Luxurious automobile lighting creates a distinct visual identity that goes beyond simple illumination. Personalized interior lighting customizes the driving experience by setting the mood with a range of colours and intensities, while intricate designs and distinctive DRLs modify exteriors. As you approach your automobile at night, welcoming lights lead the way, resulting in an interior that is perfectly lit. Not only is this symphony of light aesthetically pleasing, but it also stands as a tribute to luxury. Upcoming developments like gesture-controlled lighting and holographic displays promise to further enhance the experience.
Fuel Efficiency Takes the Lead: Illuminating Sustainability
The worldwide automotive lighting market is undergoing a significant transition towards energy-efficient solutions, as environmental concerns gain prominence. LED technology is leading the way, providing a ray of hope for the environment and drivers alike. LED lights beam brighter and use a lot less energy than conventional halogen lamps. There are some tangible advantages to this. For drivers, this translates to increased fuel economy, which lowers petrol prices and lessens reliance on fossil fuels. Greater air quality and a reduction in the transport sector's contribution to climate change are the results of reduced overall emissions.
To Learn more about this report,
Global Automotive Lighting Market Restraints and Challenges:
Although the global automotive lighting business is booming, there are still unknowns. Difficulties impede growth even as innovation propels it with eye catching features like laser beams and adaptable headlights. These technologies are luxury items due to their high cost and difficult integration, which puts producers' abilities to the test. The worldwide patchwork created by unclear legislation limits the potential of innovation. Durability issues persist, particularly when complex systems are subjected to challenging conditions. Ultimately, a lot of drivers still don't fully understand how these improvements can help them. Together, we can overcome these obstacles. The keys to reducing costs are improved production, more seamless integration, and unified regulations. Their full potential can be realized by educating customers about the safety, efficiency, and aesthetic value of these lighting wonders. By working together, we can pave the way for an even brighter and safer future for vehicle lighting.
Global Automotive Lighting Market Opportunities:
It is made possible by advanced LED technology, which gives drivers the ability to customize their illumination for the highest level of comfort and flair. Consumers that care about the environment want greener products, and vehicle lighting complies. While solar- and self-powered lighting technologies offer a future powered by clean energy, energy-efficient LEDs lower pollution. The advent of connected lighting systems heralds a new age. Envision automobiles interacting with infrastructure and one another to minimize accidents and enhance traffic efficiency. Integrated headlights with pedestrian recognition provide unmatched safety, while dramatic taillights with eye-catching displays alert onlookers to your intentions. The possibilities are endless in the future. Gesture-controlled interior illumination, holographic displays projected onto the road, and even light fixtures with self-healing capabilities.
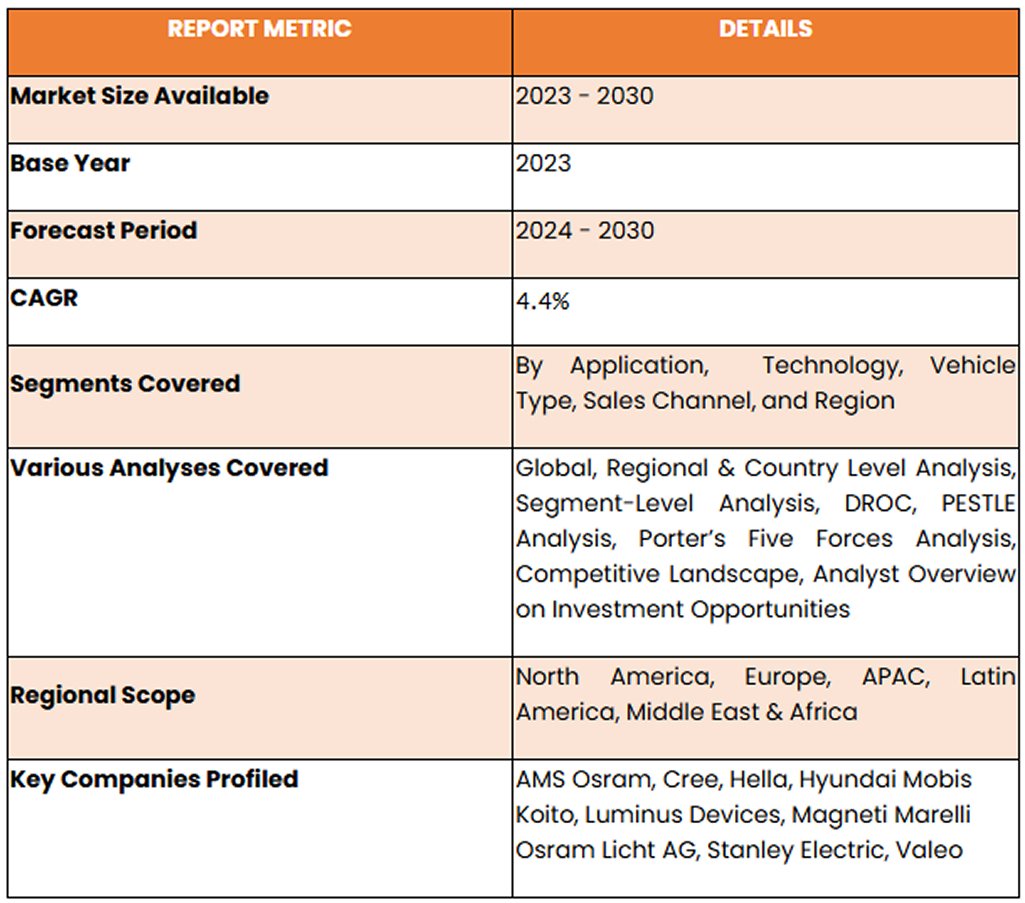
AUTOMOTIVE LIGHTING MARKET REPORT COVERAGE:
To Learn more about this report,
Global Automotive Lighting Market Segmentation: By Application
Exterior Lighting
Interior Lighting
Due to laws requiring safety features like headlights, taillights, and brake lights, exterior lighting presently holds the most market share in the vehicle lighting industry. The dominance of this market is partly attributed to advancements in safety-focused technologies such as adaptive headlights and daytime running lights. The market value of external lighting is increased by the quick adoption of technology like LED bulbs and laser lights, which improve performance and aesthetics. Conversely, the interior lighting market is expected to increase at the fastest rate in the upcoming years. Innovations like ambient lighting and technology breakthroughs like LED and OLED displays, driven by consumer demand for comfort and personalisation, open new possibilities. The spread of sophisticated interior lighting systems is further driven by the growing emphasis on safety and the expansion of the luxury car market.
Global Automotive Lighting Market Segmentation: By Technology
Halogen
LED (Light-Emitting Diode)
Xenon
Emerging Technologies
The worldwide vehicle lighting market is currently dominated by halogen because of its more affordable price, advanced technology, and useful illumination. With its dependable supply chain and affordable option for manufacturers and cost-conscious customers, halogen holds the biggest market share. The fastest-growing market right now is LEDs, which are predicted to shortly overtake halogen. The rapid expansion of LEDs is driven by their higher efficiency, longer lifespan, flexibility in design, and technological breakthroughs including enhanced brightness. Because LEDs use less energy and produce fewer emissions and better fuel economy, they are becoming more and more popular in the changing automotive lighting market.
Global Automotive Lighting Market Segmentation: By Vehicle Type
Passenger Cars
Commercial Vehicles
Passenger automobiles rule the worldwide automotive lighting market. The sheer number of passenger cars produced which surpasses that of business vehicles and fuels the need for lighting systems is the primary cause of this popularity. The growing demand for personal automobiles in developing nations is a result of rising disposable income, which in turn drives the rise of the passenger car market. The importance that consumers place on safety and aesthetics elements helps to drive market expansion. But in the upcoming years, the market for electric and hybrid cars is expected to develop at the quickest rate. The exponential rise of the worldwide electric car market, which is still expanding and shows no signs of slowing down, is what is driving this surge. Specialised lighting solutions are required since electric and hybrid vehicles have different lighting requirements because of their specific functionality and design aesthetics.
Global Automotive Lighting Market Segmentation: By Sales Channel
OEM (Original Equipment Manufacturers)
Aftermarket
Most lighting systems sold nowadays are sold by OEMs (Original Equipment Manufacturers), primarily because manufacturers pre-install lighting systems in new cars. But in the next years, the aftermarket is expected to develop at the quickest rate. This spike in demand for replacement parts, especially lighting systems, can be linked to several variables, one of them being the average age of cars. The industry is expanding because of consumers' growing desire to personalise their cars with aftermarket lighting upgrades such LED upgrades and decorative lighting. The availability and affordability of technologies like adaptive headlights and laser lights in the aftermarket, together with other advancements in lighting technology, are driving demand even more. Moreover, the growing market for electric cars (EVs).
To Learn more about this report,
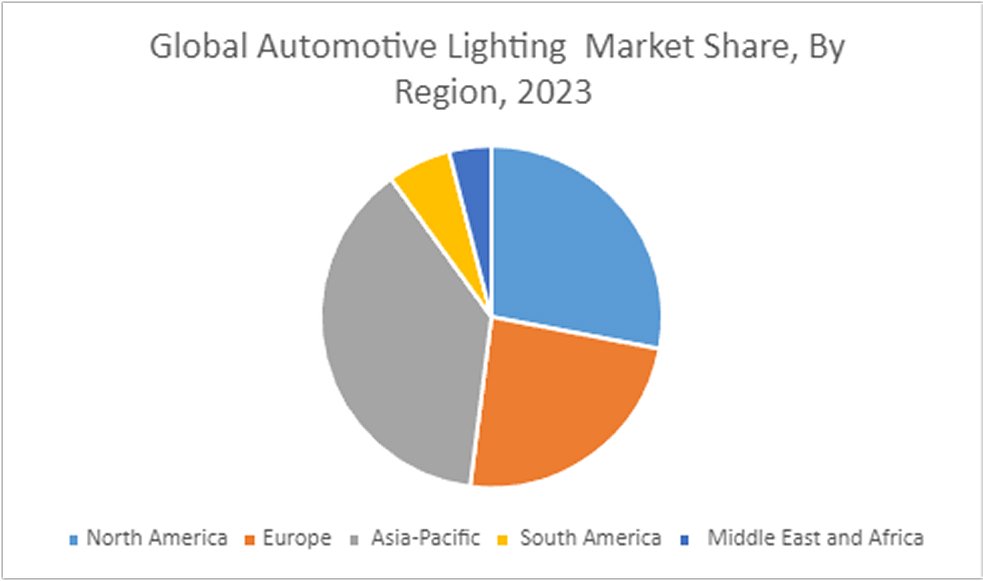
Global Automotive Lighting Market Segmentation: By Region
North America
Asia-Pacific
Europe
South America
Middle East and Africa
Throughout the forecast period, Asia Pacific is anticipated to be the automotive lighting market with the highest profitability. Over the past few years, Asia Pacific countries like China and India have seen notable increases in automotive manufacturing and sales, primarily in the medium-to premium luxury car segment. Asia Pacific is predicted to see an increase in the manufacturing of passenger cars, with India experiencing the strongest growth rate. Depending on the state of the national economy, the area offers a suitable selection of both high-end and cheap cars. For instance, there is a substantial demand for halogen, Xenon/HID, and LED since China and India produce more economy and mid-range automobiles. On the other hand, luxury car adoption rates are greater in South Korea and Japan, where LED lighting is the norm.
COVID-19 Impact Analysis on the Global Automotive Lighting Market:
A brief shadow was thrown by COVID-19 over the worldwide automotive lighting market. Production was stopped by lockdowns and supply chain disruptions, while luxury lighting upgrades were shelved by consumers on a tight budget. Resources became scarce, and R&D stagnated. Still, the market is recovering thanks to resurgent demand and rearranged priorities. While energy-efficient LEDs are being pushed towards adoption by sustainability, safety concerns are driving interest in features like pedestrian detection and adaptive headlights. The digital push of the epidemic creates opportunities for intelligent, networked lighting systems that may interact with infrastructure and other cars. Ultimately, the industry is positioned to shine brighter, focused on safety, sustainability, and a connected future, even though the pandemic dimmed its brilliance.
Recent Trends and Developments in the Global Automotive Lighting Market:
A development collaboration between OSRAM Continental and REHAU aims to incorporate lighting into external components, providing automobile manufacturers with innovative lighting options that improve functionality and design flexibility. For rear combination lamps, Hella unveiled a revolutionary lighting innovation called Hella FlatLight technology. A Memorandum of Understanding (MoU) was signed by Samvardhana Motherson Automotive Systems Group BV (SMRPBV), a division of Motherson Group, and Marelli Automotive Lighting to investigate a technology collaboration focused on intelligently lighted external body components. Valeo debuted their revolutionary 360° lighting system at the Shanghai Auto Show. This technology surrounds the car with a band of light, projecting instantaneous, clear signs that other drivers can see from a distance. Pedestrians, cyclists, and scooter riders are especially susceptible to these signals
Key Players:
AMS Osram
Cree
Hella
Hyundai Mobis
Koito
Luminus Devices
Magneti Marelli
Osram Licht AG
Stanley Electric
Valeo
Chapter 1. MEDICAL IMAGING PACS & VNA MARKET – SCOPE & METHODOLOGY
1.1. Market Segmentation
1.2. Scope, Assumptions & Limitations
1.3. Research Methodology
1.4. Primary Source
1.5. Secondary Source Chapter 2. MEDICAL IMAGING PACS & VNA MARKET – EXECUTIVE SUMMARY
2.1. Market Size & Forecast – (2026 – 2030) ($M/$Bn)
2.2. Key Trends & Insights
2.2.1. Demand Side
2.2.2. Supply Side
2.3. Attractive Investment Propositions
2.4. COVID-19 Impact Analysis Chapter 3. MEDICAL IMAGING PACS & VNA MARKET – COMPETITION SCENARIO
3.1. Market Share Analysis & Company Benchmarking
3.2. Competitive Strategy & Packaging COMPONENT Scenario
3.3. Competitive Pricing Analysis
3.4. Supplier-Distributor Analysis Chapter 4. MEDICAL IMAGING PACS & VNA MARKET - ENTRY SCENARIO
4.1. Regulatory Scenario
4.2. Case Studies – Key Start-ups
4.3. Customer Analysis
4.4. PESTLE Analysis
4.5. Porters Five Force Model
4.5.1. Bargaining Power of Suppliers
4.5.2. Bargaining Powers of Customers
4.5.3. Threat of New Entrants
4.5.4. Rivalry among Existing Players
4.5.5. Threat of Substitutes Players
4.5.6. Threat of Substitutes Chapter 5. MEDICAL IMAGING PACS & VNA MARKET - LANDSCAPE
5.1. Value Chain Analysis – Key Stakeholders Impact Analysis
5.2. Market Drivers
5.3. Market Restraints/Challenges
5.4. Market Opportunities Chapter 6. MEDICAL IMAGING PACS & VNA MARKET – By Component
6.1 Introduction/Key Findings
6.2 Software
6.3 Hardware
6.4 Services
6.5 Others
6.6 Y-O-Y Growth trend Analysis By Component
6.7 Absolute $ Opportunity Analysis By Component , 2026-2030
Chapter 7. MEDICAL IMAGING PACS & VNA MARKET – By Deployment Mode
7.1 Introduction/Key Findings
7.2 On-Premise
7.3 Cloud-Based
7.4 Hybrid
7.5 Others
7.6 Y-O-Y Growth trend Analysis By Deployment Mode
7.7 Absolute $ Opportunity Analysis By Deployment Mode, 2026-2030
8.8 Y-O-Y Growth trend Analysis Imaging Modality
8.9 Absolute $ Opportunity Analysis Imaging Modality, 2026-2030 Chapter 9. MEDICAL IMAGING PACS & VNA MARKET – By End User
9.1 Introduction/Key Findings
9.2 Hospitals
9.3 Diagnostic Imaging Centers
9.4 Specialty Clinics
9.5 Academic & Research Institutes
9.6 Others
9.7 Y-O-Y Growth trend Analysis End User
9.8 Absolute $ Opportunity Analysis, End User 2026-2030
Chapter 10. MEDICAL IMAGING PACS & VNA MARKET , By Geography – Market Size, Forecast, Trends & Insights
10.1. North America
10.1.1. By Country
10.1.1.1. U.S.A.
10.1.1.2. Canada
10.1.1.3. Mexico
10.1.2. By Component
10.1.3. By End User
10.1.4. By Imaging Modality
10.1.5. Deployment Mode
10.1.6. Countries & Segments - Market Attractiveness Analysis
10.2. Europe
10.2.1. By Country
10.2.1.1. U.K.
10.2.1.2. Germany
10.2.1.3. France
10.2.1.4. Italy
10.2.1.5. Spain
10.2.1.6. Rest of Europe
10.2.2. By Component
10.2.3. By End User
10.2.4. By Imaging Modality
10.2.5. Deployment Mode
10.2.6. Countries & Segments - Market Attractiveness Analysis
10.3. Asia Pacific
10.3.1. By Country
10.3.1.2. China
10.3.1.2. Japan
10.3.1.3. South Korea
10.3.1.4. India
10.3.1.5. Australia & New Zealand
10.3.1.6. Rest of Asia-Pacific
10.3.2. By Component
10.3.3. By Deployment Mode
10.3.4. By Imaging Modality
10.3.5. End User
10.3.6. Countries & Segments - Market Attractiveness Analysis
10.4. South America
10.4.1. By Country
10.4.1.1. Brazil
10.4.1.2. Argentina
10.4.1.3. Colombia
10.4.1.4. Chile
10.4.1.5. Rest of South America
10.4.2. By Deployment Mode
10.4.3. By Component
10.4.4. By End User
10.4.5. Imaging Modality
10.4.6. Countries & Segments - Market Attractiveness Analysis
10.5. Middle East & Africa
10.5.1. By Country
10.5.1.4. United Arab Emirates (UAE)
10.5.1.2. Saudi Arabia
10.5.1.3. Qatar
10.5.1.4. Israel
10.5.1.5. South Africa
10.5.1.6. Nigeria
10.5.1.7. Kenya
10.5.1.10. Egypt
10.5.1.10. Rest of MEA
10.5.2. By Deployment Mode
10.5.3. By Component
10.5.4. By Imaging Modality
10.5.5. End User
10.5.6. Countries & Segments - Market Attractiveness Analysis Chapter 11. MEDICAL IMAGING PACS & VNA MARKET – Company Profiles – (Overview, Portfolio, Financials, Strategies & Developments)
11.1 GE HealthCare
11.2 Philips Healthcare
11.3 Siemens Healthineers
11.4 Fujifilm Holdings Corporation
11.5 Agfa-Gevaert Group
11.6 Sectra AB
11.7 Merge Healthcare
11.8 Intelerad Medical Systems
11.9 Carestream Health
11.10 Konica Minolta, Inc.
Fill out the form below and our team will get back to you shortly
FAQ's
In 2025, the Medical Imaging PACS & VNA Market was valued at approximately USD 4.85 Billion. It is projected to grow at a CAGR of around 11.9% during the forecast period of 2026–2030, reaching an estimated USD 8.51 Billion by 2030.
The major drivers of the Global Medical Imaging PACS & VNA Market include the increasing need for interoperable enterprise imaging environments across healthcare systems, the rapid shift toward cloud-based and hybrid imaging infrastructure, and rising demand for scalable image storage and disaster recovery solutions. Growth is further supported by increasing imaging volumes, modernization of legacy PACS systems, stronger focus on workflow efficiency, and growing concerns around cybersecurity, data sovereignty, and vendor lock-in. In addition, healthcare providers are prioritizing multi-site image accessibility, archive consolidation, and AI-enabled imaging workflows, which continue to accelerate market expansion globally.
Software, Services, and Others are the segments under the Global Medical Imaging PACS & VNA Market by Component. On-Premises, Cloud-Based, Hybrid, and Others are the segments by Deployment Mode. Radiology, Cardiology, Oncology, Orthopedics, Mammography, and Others are the segments by Imaging Modality. Hospitals, Diagnostic Imaging Centers, Specialty Clinics, Academic & Research Institutes, and Others are the segments by End User.
North America is the most dominant region for the Global Medical Imaging PACS & VNA Market, holding approximately 39% share. This leadership is driven by advanced healthcare IT infrastructure, established imaging networks, strong replacement demand, and rising investments in enterprise archive modernization. Asia Pacific holds the fastest growth outlook due to expanding hospital infrastructure, rising imaging volumes, rapid cloud adoption, and increasing healthcare digitization across emerging economies. Europe accounts for a significant share supported by mature healthcare systems, while Latin America and the Middle East & Africa continue to gain traction through ongoing healthcare modernization initiatives.
The key players in the Global Medical Imaging PACS & VNA Market include GE HealthCare, Philips Healthcare, Siemens Healthineers, Fujifilm Holdings Corporation, Agfa-Gevaert Group, Sectra AB, Merge Healthcare, Intelerad Medical Systems, Carestream Health, Konica Minolta, Inc., Canon Medical Systems Corporation, Dedalus Group, Hyland Software, Inc., INFINITT Healthcare Co., Ltd., and Novarad Corporation.
More related reports
Get expert-driven market research reports from a leading research partner to help you navigate the future of the global industry.
Report Code: VMR-19361 | Published Date: May 2026 | Format: Excel and PDF
In 2025, the Newborn Screening Market was valued at approximately USD 6.14 Billion. It is projected to grow at a CAGR of around 7.6% during the forecast period of 2026–2030, reaching an estimated USD 8.86 Billion by 2030...
Report Code: VMR-19360 | Published Date: May 2026 | Format: Excel and PDF
In 2025, the Home Diagnostics & Self-Testing Market was valued at approximately USD 9.85 Billion. It is projected to grow at a CAGR of around 7.9% during the forecast period of 2026–2030, reaching an estimated USD 14.41...
Report Code: VMR-19359 | Published Date: May 2026 | Format: Excel and PDF
In 2025, the Home Diagnostics & Self-Testing Market was valued at approximately USD 9.85 Billion. It is projected to grow at a CAGR of around 7.9% during the forecast period of 2026–2030, reaching an estimated USD 14.41...
Report Code: VMR-19358 | Published Date: May 2026 | Format: Excel and PDF
In 2025, the Clinical Microbiology Testing Market was valued at approximately USD 9.85 Billion. It is projected to grow at a CAGR of around 7.9% during the forecast period of 2026–2030, reaching an estimated USD 14.41 Bi...
Report Code: VMR-19356 | Published Date: May 2026 | Format: Excel and PDF
In 2025, the Global Fertility Services & IVF Technology Market was valued at approximately USD 53 Billion and is projected to reach around USD 82.30 Billion by 2030, expanding at a CAGR of about 9.2% during 2026–2030.
“We received a complex piece of work for our niche market from Virtue Market research in short period of time. I appreciate the quality and content of the final files we received. Thanks for the support”
Medical Devices Company based in Europe
“We received a complex piece of work for our niche market from Virtue Market research in short period of time. I appreciate the quality and content of the final files we received. Thanks for the support”
Medical Devices Company based in Europe
“We received a complex piece of work for our niche market from Virtue Market research in short period of time. I appreciate the quality and content of the final files we received. Thanks for the support”
Medical Devices Company based in Europe
“We received a complex piece of work for our niche market from Virtue Market research in short period of time. I appreciate the quality and content of the final files we received. Thanks for the support”
Medical Devices Company based in Europe
“We received a complex piece of work for our niche market from Virtue Market research in short period of time. I appreciate the quality and content of the final files we received. Thanks for the support”
Medical Devices Company based in Europe
“We received a complex piece of work for our niche market from Virtue Market research in short period of time. I appreciate the quality and content of the final files we received. Thanks for the support”